1990
1995
2000
2005
2010
2015
0
2B
4B
6B
8B
10B
12B
14B
16B
Coal
Hydroelectric Conventional
Natural Gas
Nuclear
Other
Petroleum
Solar Thermal and Photovoltaic
Wind
Energy Generation by Source
in the United States 1990-2015
Year
Energy Generation (Mwh)
plotly-logomark
Edit chart
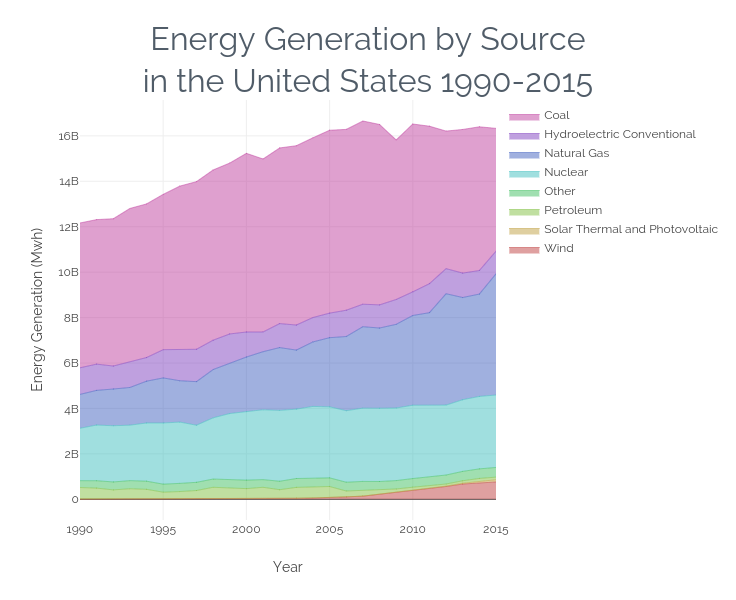
Eshope's interactive graph and data of "Energy Generation by Sourcein the United States 1990-2015" is a filled line chart, showing Wind, Solar Thermal and Photovoltaic, Petroleum, Other, Nuclear, Natural Gas, Hydroelectric Conventional, Coal; with Year in the x-axis and Energy Generation (Mwh) in the y-axis.. The x-axis shows values from 0 to 0. The y-axis shows values from 0 to 0.