Edit chart
Loading graph
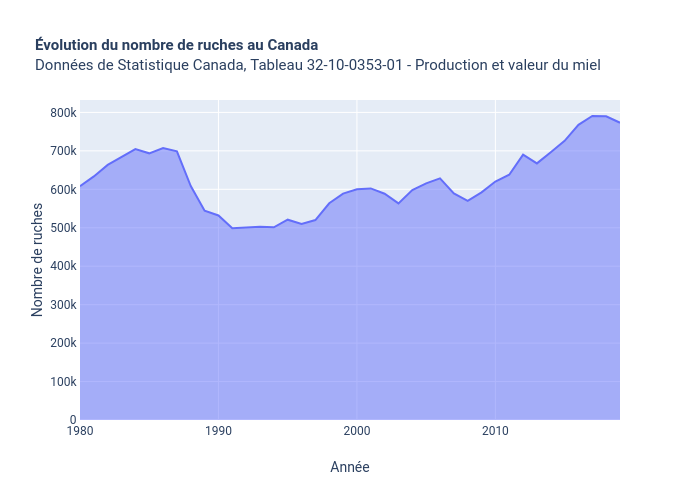
Essicolo's interactive graph and data of "Évolution du nombre de ruches au Canada Données de Statistique Canada, Tableau 32-10-0353-01 - Production et valeur du miel" is a line chart; with Année in the x-axis and Nombre de ruches in the y-axis.. The x-axis shows values from 1980 to 2019. The y-axis shows values from 0 to 832282.1052631579.