Edit chart
Loading graph
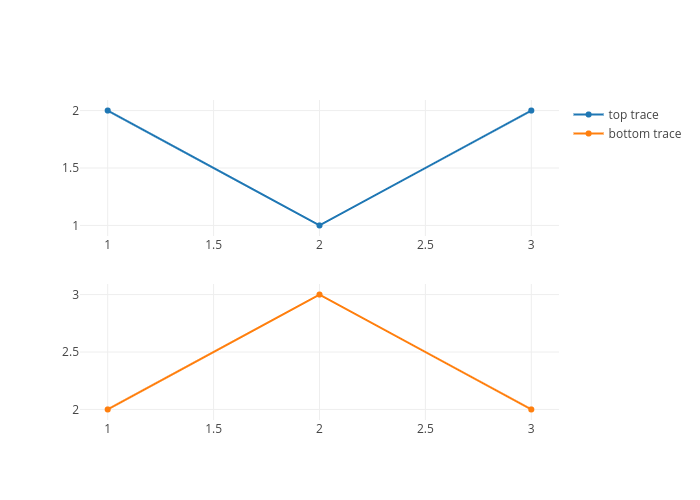
Etpinard's interactive graph and data of "top trace vs bottom trace" is a scatter chart, showing top trace vs bottom trace. The x-axis shows values from 0.8779268613522757 to 3.1220731386477243. The y-axis shows values from 0.9171014207435115 to 2.0828985792564887.