Edit chart
Loading graph
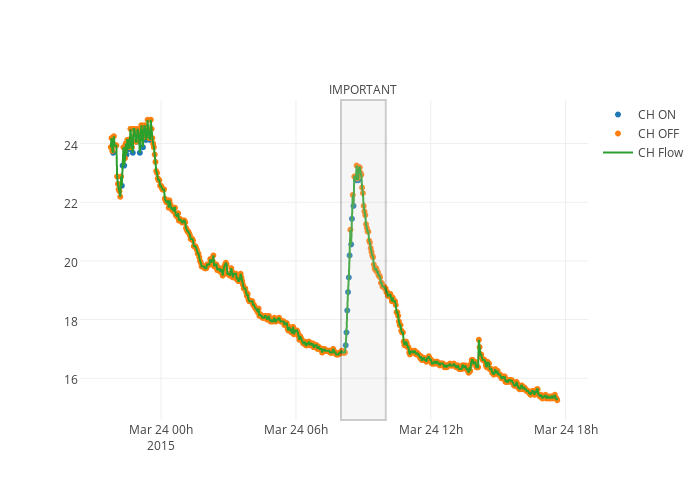
Etpinard's interactive graph and data of "CH ON, CH OFF, CH Flow" is a scatter chart, showing CH ON, CH OFF, CH Flow. The x-axis shows values from 0 to 0. The y-axis shows values from 0 to 0. This visualization has the following annotation: IMPORTANT