Edit chart
Loading graph
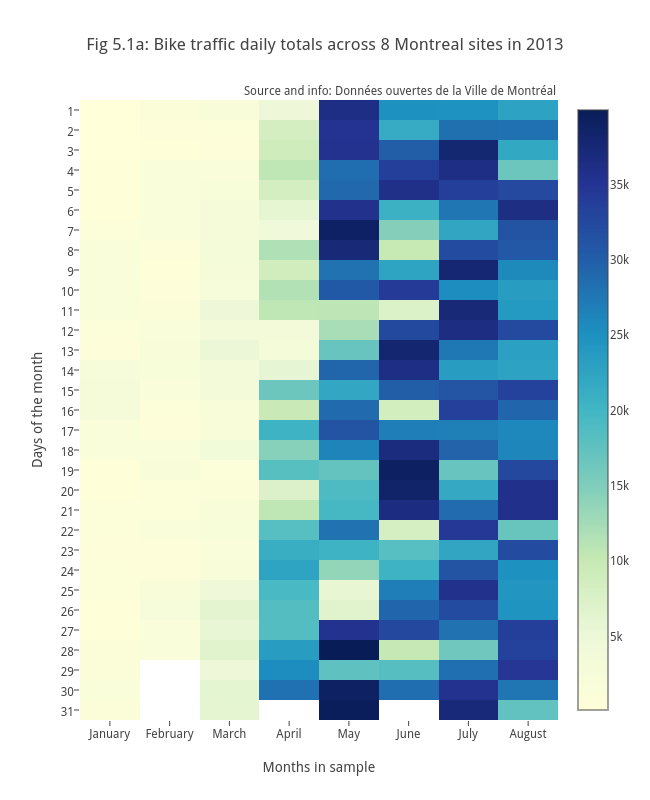
Etpinard's interactive graph and data of "Fig 5.1a: Bike traffic daily totals across 8 Montreal sites in 2013" is a heatmap; with Months in sample in the x-axis and Days of the month in the y-axis.. The x-axis shows values from -0.5 to 7.5. The y-axis shows values from 31.5 to 0.5. This visualization has the following annotation: Source and info: Données ouvertes de la Ville de Montréal