Edit chart
Loading graph
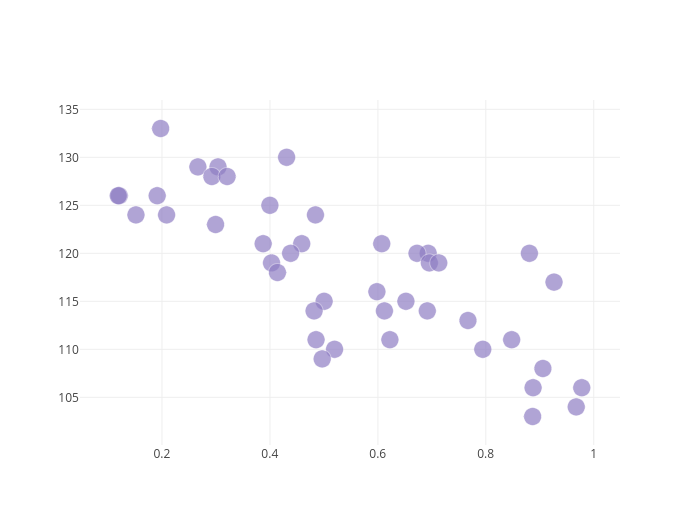
Etpinard's interactive graph and data is a scatter chart. The x-axis shows values from 0.048114138776699025 to 1.048582377223301. The y-axis shows values from 100.03125 to 135.96875.