Edit chart
Loading graph
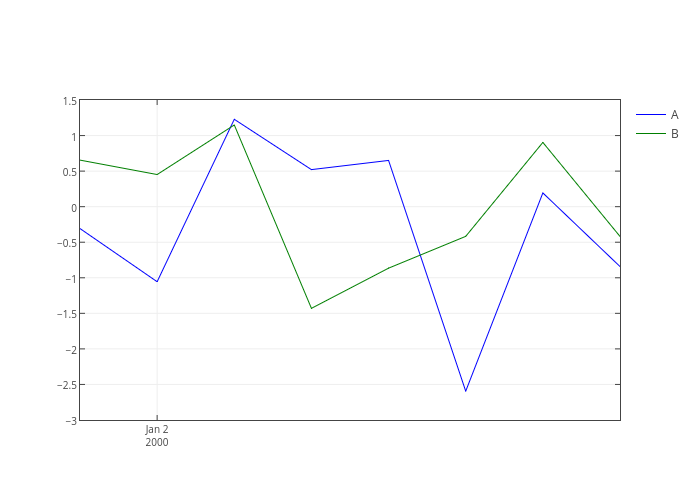
Etpinard's interactive graph and data of "A vs B" is a line chart, showing A vs B; with time in the x-axis. The x-axis shows values from 946702800000 to 947307600000. The y-axis shows values from -3 to 1.5.