Edit chart
Loading graph
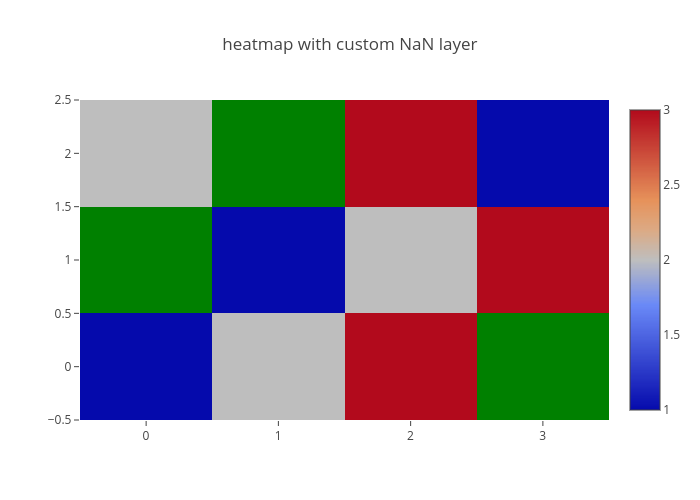
Etpinard's interactive graph and data of "heatmap with custom NaN layer" is a heatmap. The x-axis shows values from -0.5 to 3.5. The y-axis shows values from -0.5 to 2.5.