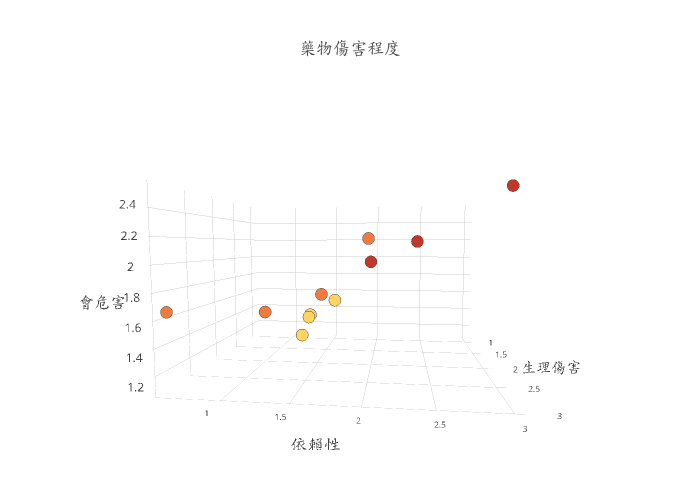
藥物傷害程度
plotly-logomark
Edit chart
F55665566's interactive graph and data of "藥物傷害程度" is a scatter3d, showing D; with B in the x-axis and C in the y-axis.. The x-axis shows values from 0 to 0. The y-axis shows values from 0 to 0.