Edit chart
Loading graph
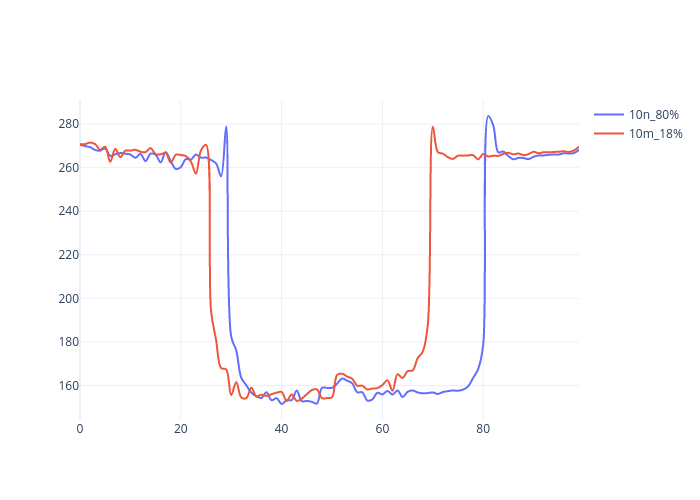
Fahin's interactive graph and data of "10n_80% vs 10m_18%" is a line chart, showing 10n_80% vs 10m_18%. The x-axis shows values from 0 to 99. The y-axis shows values from 144.15555555555557 to 291.0444444444444.