Edit chart
Loading graph
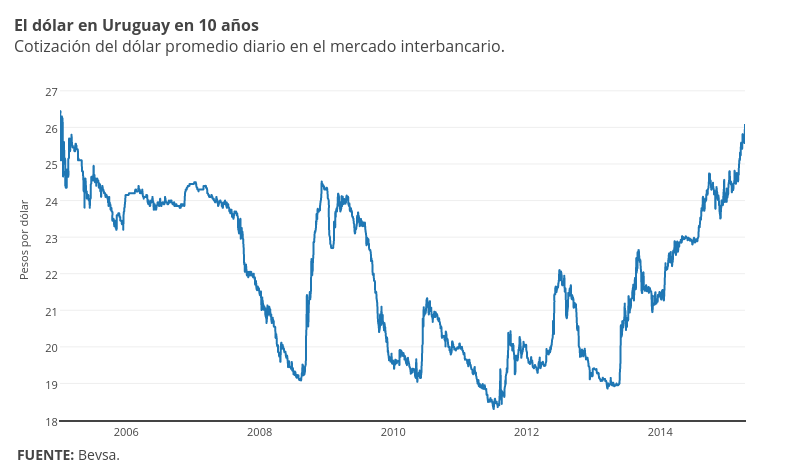
Fcomesana's interactive graph and data of "Pesos por dólar vs time" is a scatter chart, showing Col2; with time in the x-axis and Pesos por dólar in the y-axis.. The x-axis shows values from 1104717600000 to 1428548400000. The y-axis shows values from 18 to 27.842105263157894. This visualization has the following annotations: El dólar en Uruguay en 10 añosCotización del dólar promedio diario en el mercado interbancario.; FUENTE: Bevsa.