Edit chart
Loading graph
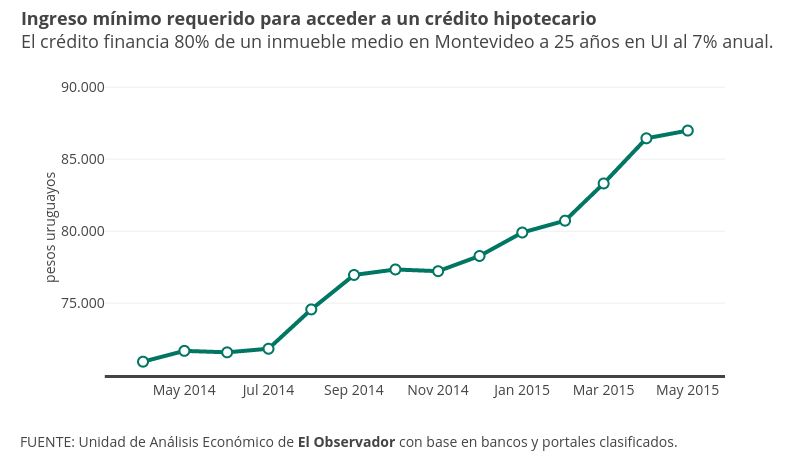
Fcomesana's interactive graph and data of "pesos uruguayos vs time" is a scatter chart, showing Ingreso mínimo; with time in the x-axis and pesos uruguayos in the y-axis.. The x-axis shows values from 1393990162003.0105 to 1432780237996.9895. The y-axis shows values from 70010 to 90500. This visualization has the following annotations: Ingreso mínimo requerido para acceder a un crédito hipotecarioEl crédito financia 80% de un inmueble medio en Montevideo a 25 años en UI al 7% anual.; FUENTE: Unidad de Análisis Económico de El Observador con base en bancos y portales clasificados.