Edit chart
Loading graph
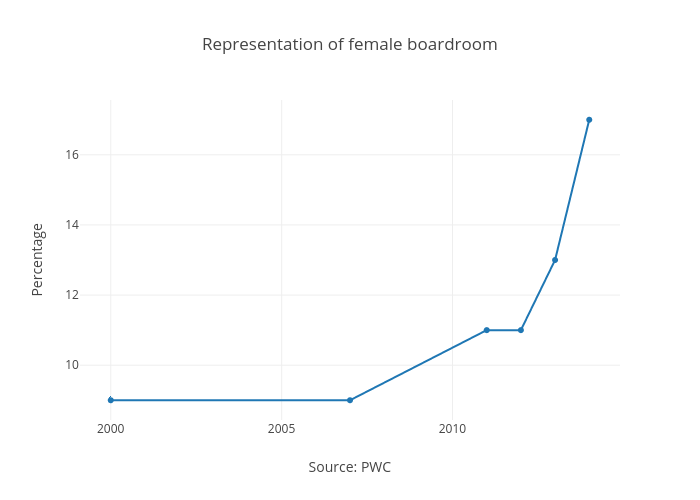
Feride's interactive graph and data of "Representation of female boardroom " is a scatter chart, showing Col2; with Source: PWC in the x-axis and Percentage in the y-axis.. The x-axis shows values from 1999.1482045425707 to 2014.8517954574293. The y-axis shows values from 8.44005544005544 to 17.55994455994456.