Edit chart
Loading graph
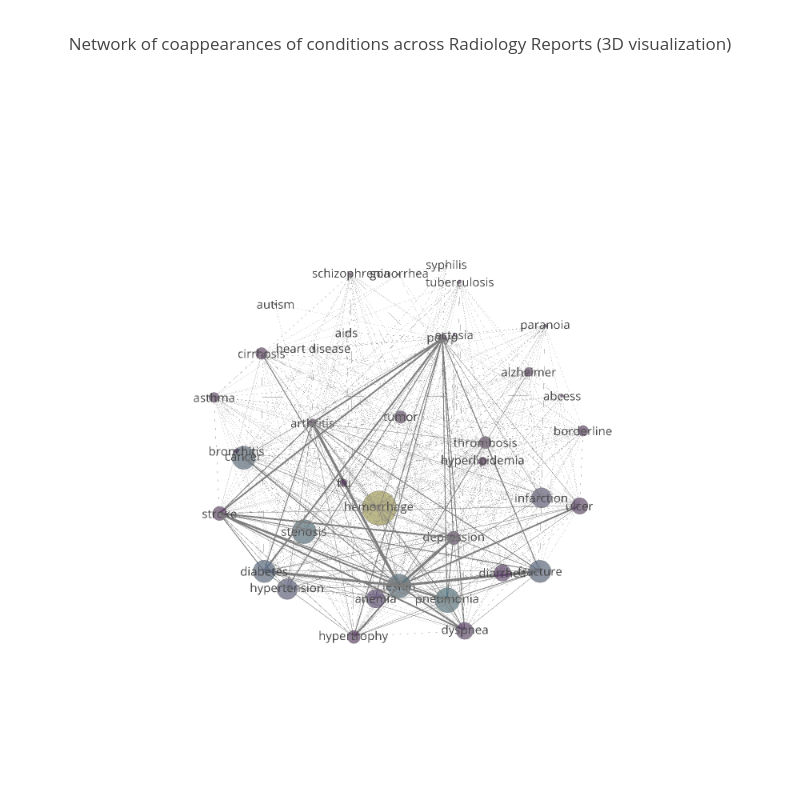
Filip1's interactive graph and data of "Network of coappearances of conditions across Radiology Reports (3D visualization)" is a scatter3d, showing actors. The x-axis shows values from 0 to 0. The y-axis shows values from 0 to 0. This visualization has the following annotation: Data source: MIMIC data