Edit chart
Loading graph
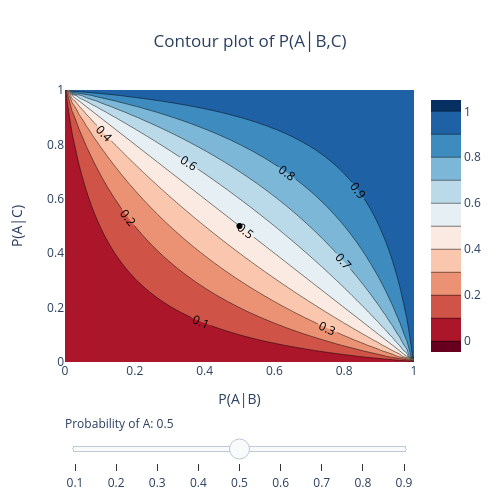
Fppereir's interactive graph and data of "Contour plot of P(A│B,C)" is a contour; with P(A|B) in the x-axis and P(A|C) in the y-axis.. The x-axis shows values from 0 to 0. The y-axis shows values from 0 to 0.