Edit chart
Loading graph
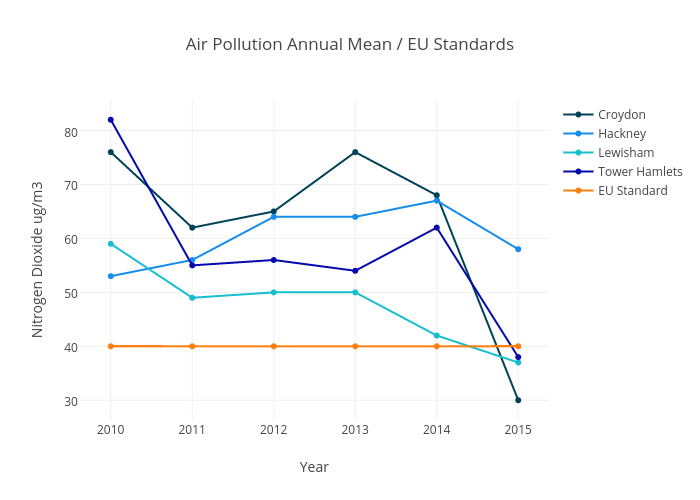
Franrankin's interactive graph and data of "Air Pollution Annual Mean / EU Standards" is a scatter chart, showing Croydon, Hackney, Lewisham, Tower Hamlets, EU Standard; with Year in the x-axis and Nitrogen Dioxide ug/m3 in the y-axis.. The x-axis shows values from 2009.6628232005592 to 2015.3371767994408. The y-axis shows values from 26.253365003958827 to 85.74663499604117.