Edit chart
Loading graph
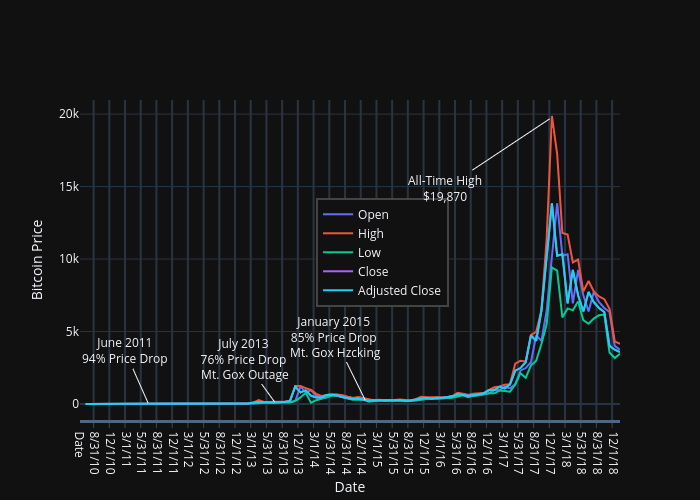
Fstanley28's interactive graph and data of "Bitcoin Price vs Date" is a line chart, showing Open, High, Low, Close, Adjusted Close; with Date in the x-axis and Bitcoin Price in the y-axis.. The x-axis shows values from 0 to 103. The y-axis shows values from -1103.9127300000002 to 20974.54187. This visualization has the following annotations: All-Time High$19,870; June 201194% Price Drop; July 201376% Price Drop Mt. Gox Outage; January 201585% Price Drop Mt. Gox Hzcking