Edit chart
Loading graph
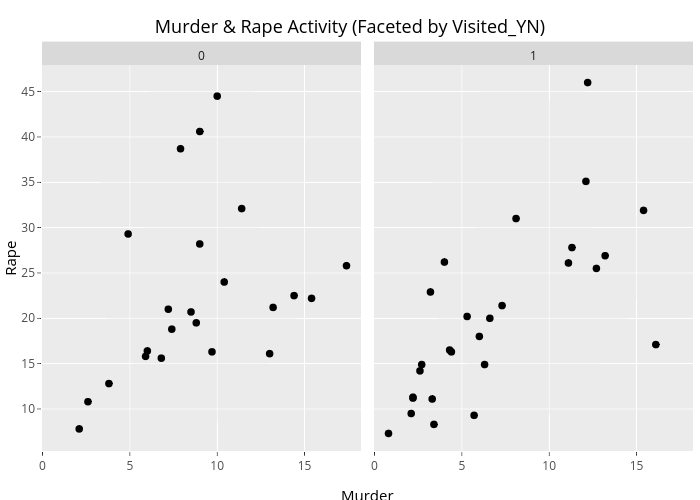
Gabegarcia's interactive graph and data of "Murder & Rape Activity (Faceted by Visited_YN)" is a scatter chart. The x-axis shows values from -0.0299999999999999 to 18.23. The y-axis shows values from 5.365 to 47.935. This visualization has the following annotations: Murder; Rape; 0; 1