Edit chart
Loading graph
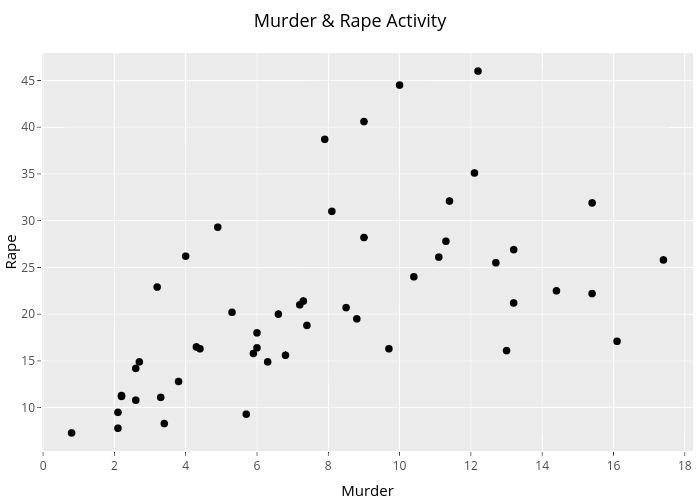
Gabegarcia's interactive graph and data of "Murder & Rape Activity" is a scatter chart; with Murder in the x-axis and Rape in the y-axis.. The x-axis shows values from -0.0299999999999999 to 18.23. The y-axis shows values from 5.365 to 47.935.