Edit chart
Loading graph
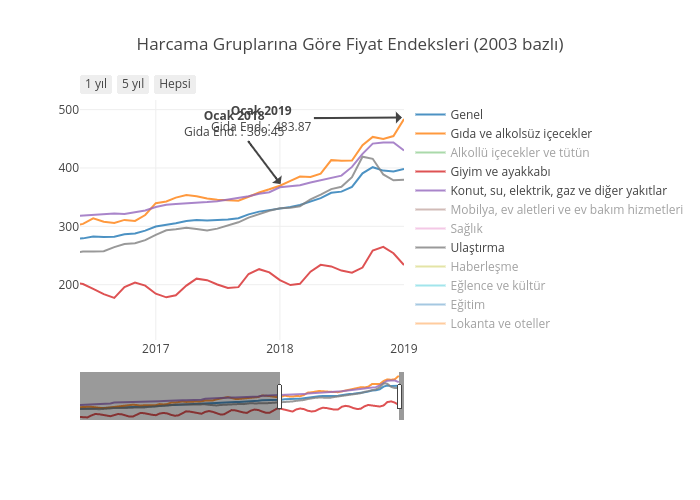
Garipbiadam's interactive graph and data of "Harcama Gruplarına Göre Fiyat Endeksleri (2003 bazlı)" is a line chart, showing Genel, Gıda ve alkolsüz içecekler, Alkollü içecekler ve tütün, Giyim ve ayakkabı, Konut, su, elektrik, gaz ve diğer yakıtlar, Mobilya, ev aletleri ve ev bakım hizmetleri, Sağlık, Ulaştırma, Haberleşme, Eğlence ve kültür, Eğitim, Lokanta ve oteller; with time in the x-axis. The x-axis shows values from 2016-05-23 04:36:12.2278 to 2019-01-01. The y-axis shows values from 105.7965485248647 to 504.66557802757046. This visualization has the following annotations: Ocak 2018Gida End. : 369.45; Ocak 2019Gida End. : 483.87