Edit chart
Loading graph
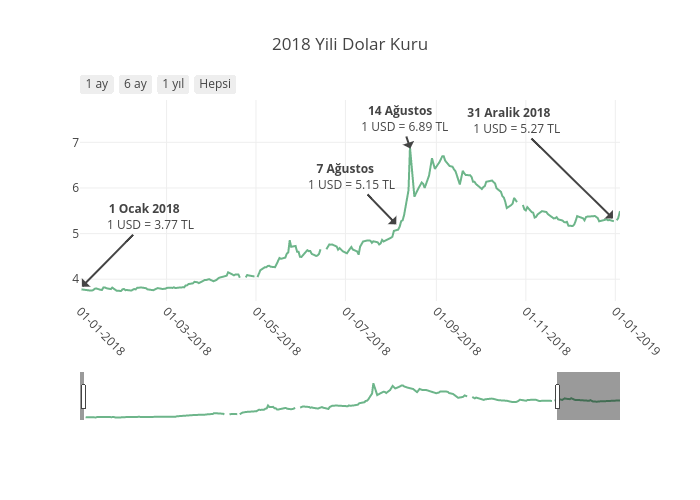
Garipbiadam's interactive graph and data of "2018 Yili Dolar Kuru" is a line chart, showing Dolar Kuru; with time in the x-axis. The x-axis shows values from 2018-01-01 to 2019-01-04 04:49:25.6648. The y-axis shows values from 3.552136257833814 to 7.385411101157532. This visualization has the following annotations: 14 Ağustos 1 USD = 6.89 TL; 7 Ağustos 1 USD = 5.15 TL; 1 Ocak 2018 1 USD = 3.77 TL; 31 Aralik 2018 1 USD = 5.27 TL