Edit chart
Loading graph
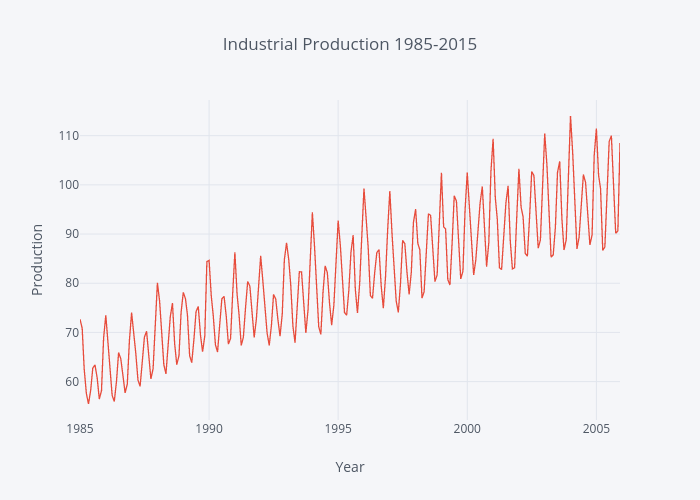
Gauravmodi's interactive graph and data of "Industrial Production 1985-2015" is a line chart, showing value. The x-axis shows values from 0 to 0. The y-axis shows values from 0 to 0.