Edit chart
Loading graph
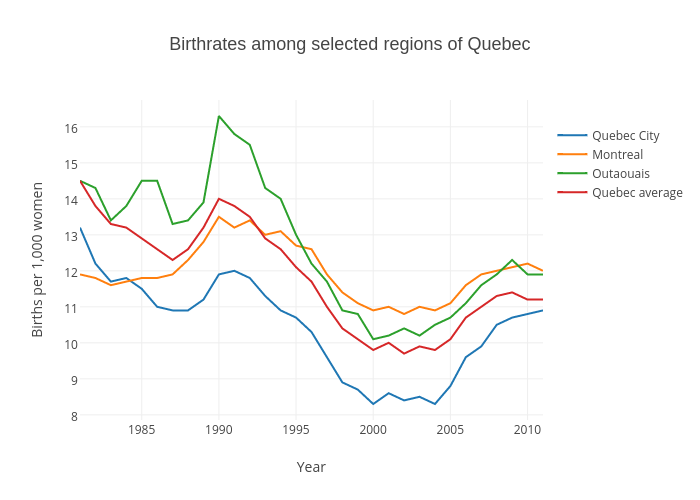
Gazettedata's interactive graph and data of "Birthrates among selected regions of Quebec" is a scatter chart, showing Quebec City, Montreal, Outaouais, Quebec average; with Year in the x-axis and Births per 1,000 women in the y-axis.. The x-axis shows values from 1981 to 2011. The y-axis shows values from 7.855555555555556 to 16.744444444444444.