Edit chart
Loading graph
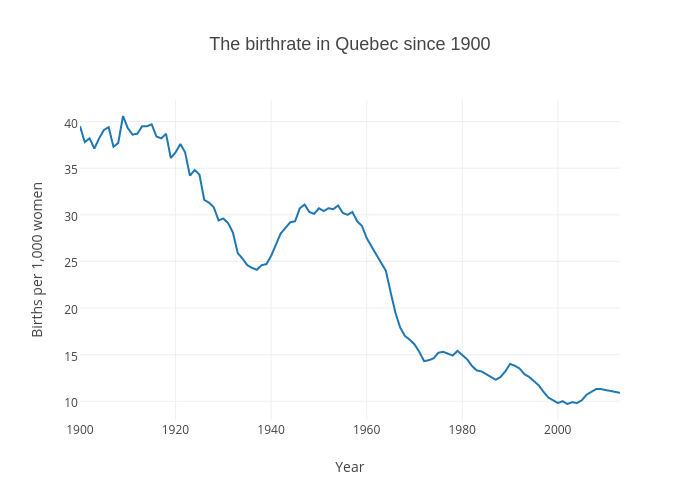
Gazettedata's interactive graph and data of "The birthrate in Quebec since 1900" is a scatter chart, showing Biths per 1,000 women; with Year in the x-axis and Births per 1,000 women in the y-axis.. The x-axis shows values from 1900 to 2013. The y-axis shows values from 7.9833333333333325 to 42.31666666666667.