Edit chart
Loading graph
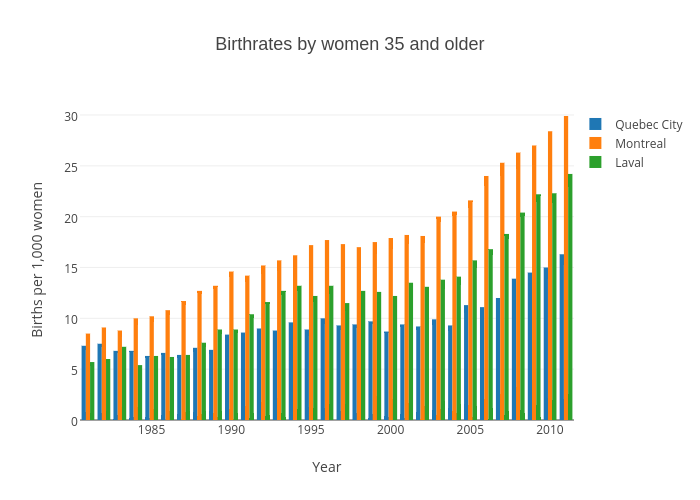
Gazettedata's interactive graph and data of "Birthrates by women 35 and older" is a grouped bar chart, showing Quebec City, Montreal, Laval; with Year in the x-axis and Births per 1,000 women in the y-axis.. The x-axis shows values from 1980.5 to 2011.5. The y-axis shows values from 0 to 31.473684210526315.