Edit chart
Loading graph
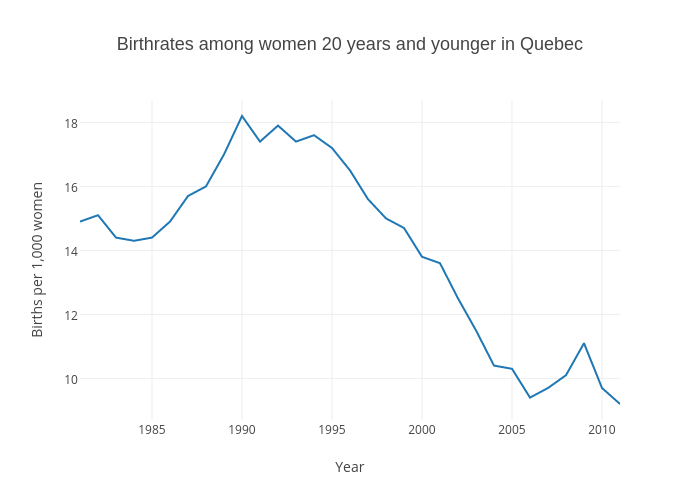
Gazettedata's interactive graph and data of "Birthrates among women 20 years and younger in Quebec" is a scatter chart, showing None; with Year in the x-axis and Births per 1,000 women in the y-axis.. The x-axis shows values from 1981 to 2011. The y-axis shows values from 8.7 to 18.7.