Edit chart
Loading graph
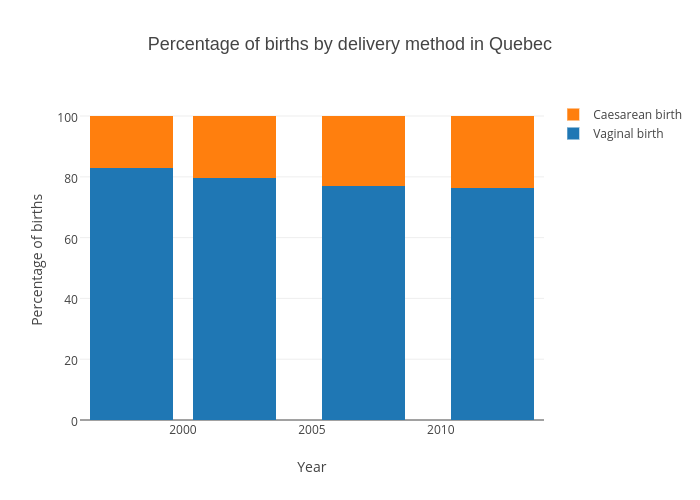
Gazettedata's interactive graph and data of "Percentage of births by delivery method in Quebec" is a stacked bar chart, showing Vaginal birth vs Caesarean birth; with Year in the x-axis and Percentage of births in the y-axis.. The x-axis shows values from 1996 to 2014. The y-axis shows values from 0 to 105.26315789473685.