Edit chart
Loading graph
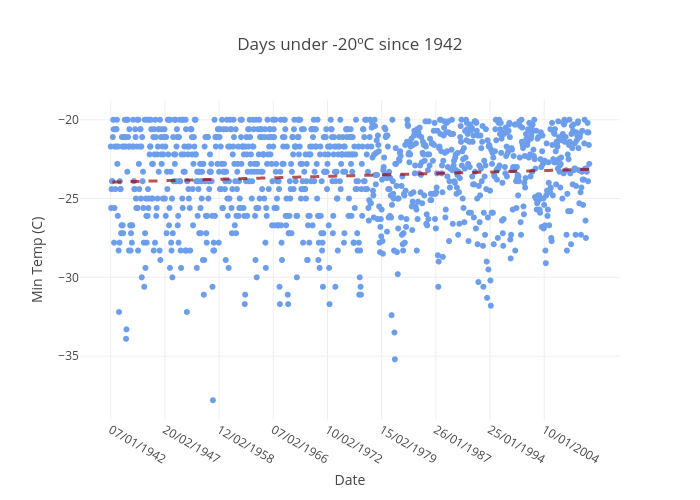
Gazettedata's interactive graph and data of "Days under -20ºC since 1942" is a scatter chart, showing Min Temp (C) vs Min Temp (C) - fit; with Date in the x-axis and Min Temp (C) in the y-axis.. The x-axis shows values from 1228.0609962009287 to -71.06099620092867. The y-axis shows values from -38.9450621183407 to -18.854937881659296.