Edit chart
Loading graph
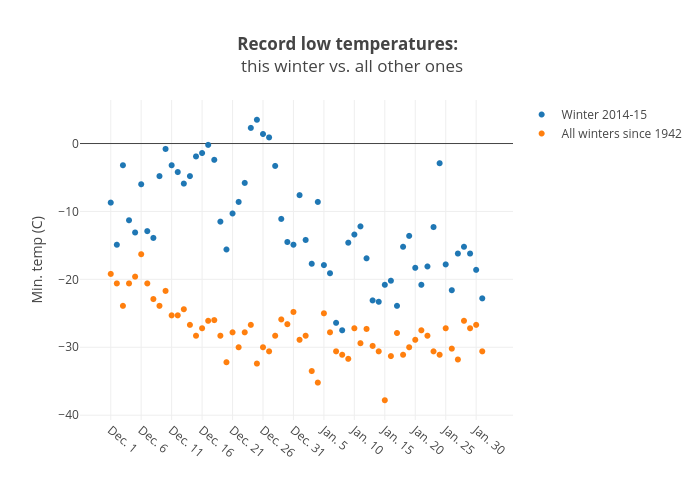
Gazettedata's interactive graph and data of "Record low temperatures: this winter vs. all other ones" is a scatter chart, showing Winter 2014-15 vs All winters since 1942; with Min. temp (C) in the y-axis. The x-axis shows values from -3.786832628777203 to 64.7868326287772. The y-axis shows values from -40.522512437810946 to 6.222512437810945.