2
2.5
3
3.5
4
4.5
5
0
5
10
15
20
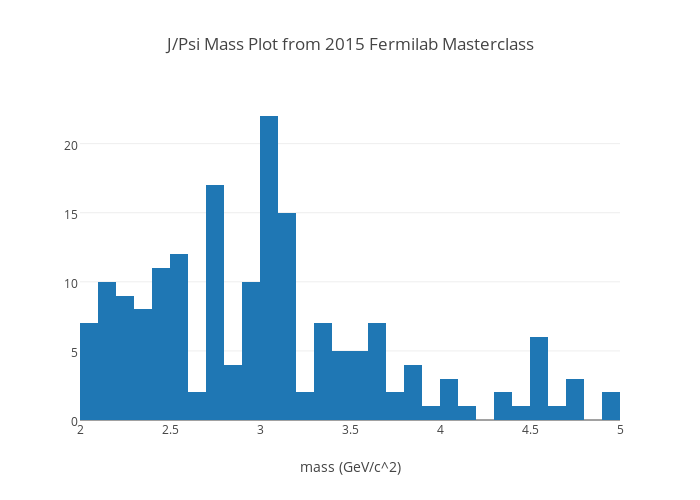
J/Psi Mass Plot from 2015 Fermilab Masterclass
mass (GeV/c^2)
plotly-logomark
Edit chart
Gcschmit's interactive graph and data of "J/Psi Mass Plot from 2015 Fermilab Masterclass" is a histogram, showing Col2; with mass (GeV/c^2) in the x-axis. The x-axis shows values from 2 to 4.999999999999998. The y-axis shows values from 0 to 23.157894736842106.