Edit chart
Loading graph
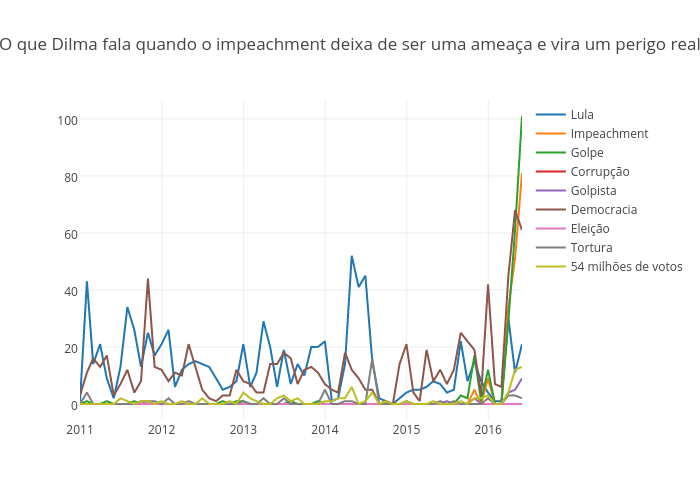
Gfelitti's interactive graph and data of "O que Dilma fala quando o impeachment deixa de ser uma ameaça e vira um perigo real" is a scatter chart, showing Lula, Impeachment, Golpe, Corrupção, Golpista, Democracia, Eleição, Tortura, 54 milhões de votos; with time in the x-axis. The x-axis shows values from 1293760800000 to 1464663600000. The y-axis shows values from -5.61111111111111 to 106.61111111111111.