Edit chart
Loading graph
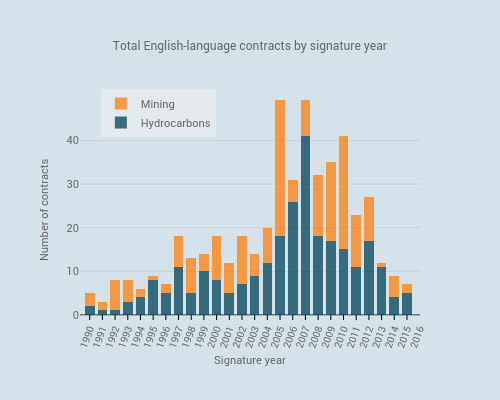
Giocek's interactive graph and data of "Total English-language contracts by signature year" is a stacked bar chart, showing Hydrocarbons vs Mining; with Signature year in the x-axis and Number of contracts in the y-axis.. The x-axis shows values from 1989.2358545031625 to 2016.027672385954. The y-axis shows values from -1.1873065944428731 to 49.31653203489961.