Edit chart
Loading graph
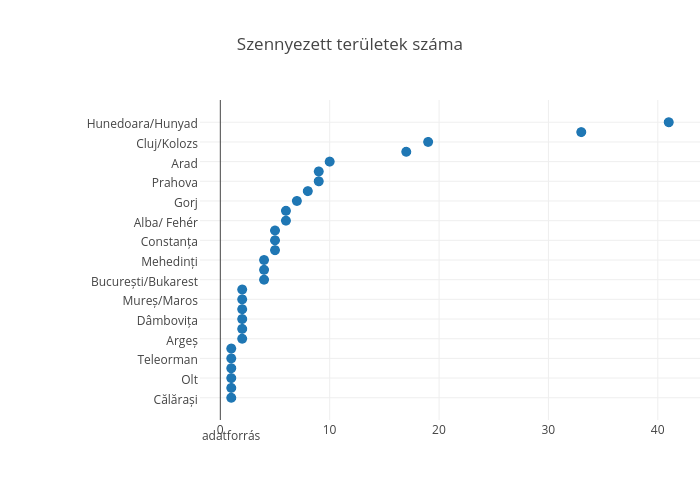
Glazurator's interactive graph and data of "Szennyezett területek száma" is a scatter chart, showing A; with in the x-axis and in the y-axis.. The x-axis shows values from -1.465993856954805 to 43.4659938569548. The y-axis shows values from -1.8941319867664987 to 29.8941319867665. This visualization has the following annotation: adatforrás