Edit chart
Loading graph
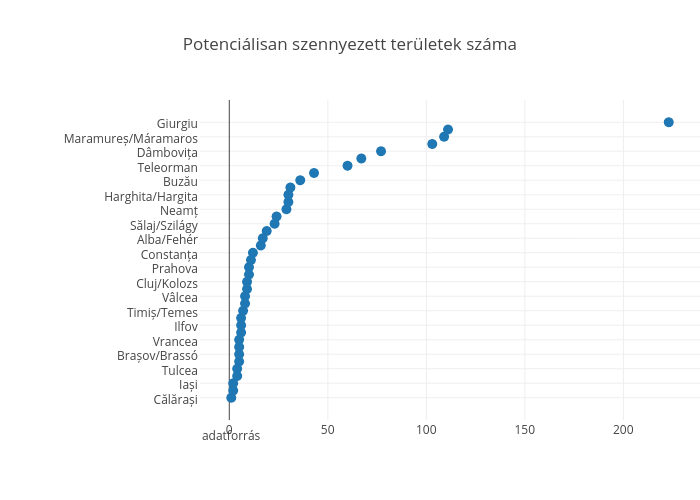
Glazurator's interactive graph and data of "Potenciálisan szennyezett területek száma" is a scatter chart, showing A; with in the y-axis. The x-axis shows values from -12.686265906099166 to 236.68626590609915. The y-axis shows values from -2.570607696325962 to 40.570607696325965. This visualization has the following annotation: adatforrás