Edit chart
Loading graph
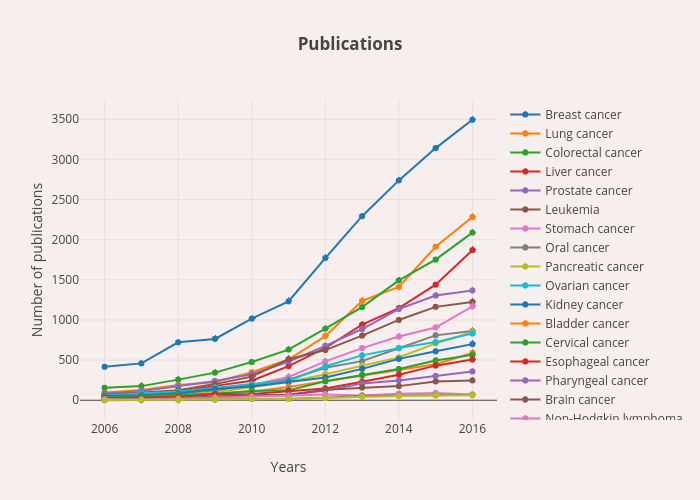
Glib_radchenko's interactive graph and data of "Publications" is a line chart, showing Breast cancer, Lung cancer, Colorectal cancer, Liver cancer, Prostate cancer, Leukemia, Stomach cancer, Oral cancer, Pancreatic cancer, Ovarian cancer, Kidney cancer, Bladder cancer, Cervical cancer, Esophageal cancer, Pharyngeal cancer, Brain cancer, Non-Hodgkin lymphoma, Laryngeal cancer, Gallbladder cancer; with Years in the x-axis and Number of publications in the y-axis.. The x-axis shows values from 2005.3570379693729 to 2016.6429620306271. The y-axis shows values from -283.5645756457564 to 3776.5645756457566.