Edit chart
Loading graph
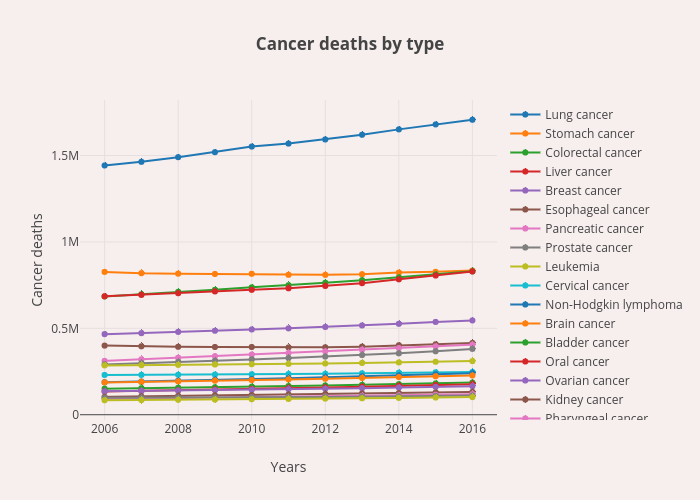
Glib_radchenko's interactive graph and data of "Cancer deaths by type" is a line chart, showing Lung cancer, Stomach cancer, Colorectal cancer, Liver cancer, Breast cancer, Esophageal cancer, Pancreatic cancer, Prostate cancer, Leukemia, Cervical cancer, Non-Hodgkin lymphoma, Brain cancer, Bladder cancer, Oral cancer, Ovarian cancer, Kidney cancer, Pharyngeal cancer, Laryngeal cancer, Gallbladder cancer; with Years in the x-axis and Cancer deaths in the y-axis.. The x-axis shows values from 2005.3570379693729 to 2016.6429620306271. The y-axis shows values from -48021.254612546094 to 1838646.2546125462.