Edit chart
Loading graph
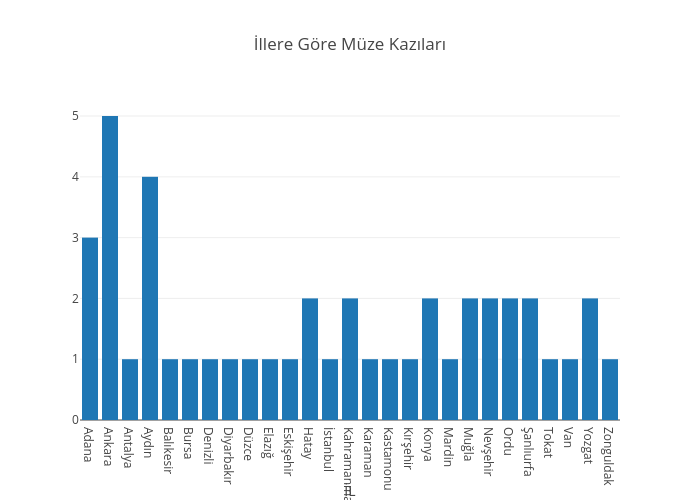
Goksinsaygin's interactive graph and data of "İllere Göre Müze Kazıları" is a histogram, showing İL; with İL in the x-axis. The x-axis shows values from -0.5 to 26.5. The y-axis shows values from 0 to 5.2631578947368425.