Edit chart
Loading graph
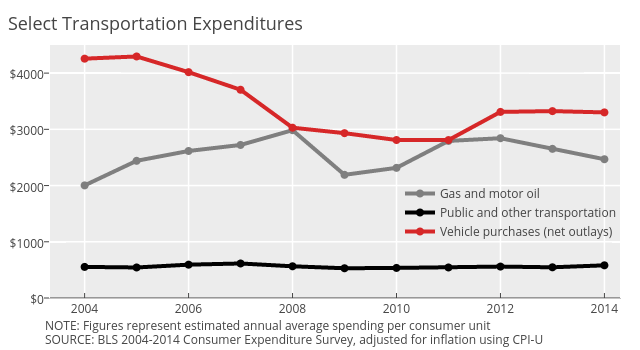
Governing's interactive graph and data of "Gas and motor oil, Public and other transportation, Vehicle purchases (net outlays) " is a line chart, showing Gas and motor oil, Public and other transportation, Vehicle purchases (net outlays) . The x-axis shows values from 2003.3339960238568 to 2014.3. The y-axis shows values from 0 to 4500. This visualization has the following annotations: NOTE: Figures represent estimated annual average spending per consumer unit; SOURCE: BLS 2004-2014 Consumer Expenditure Survey, adjusted for inflation using CPI-U; Select Transportation Expenditures