Edit chart
Loading graph
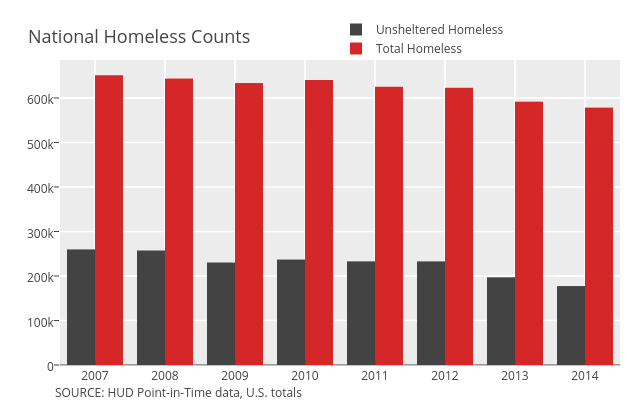
Governing's interactive graph and data of "Unsheltered Homeless vs Total Homeless" is a grouped bar chart, showing Unsheltered Homeless vs Total Homeless. The x-axis shows values from 2006.5 to 2014.5. The y-axis shows values from 0 to 685412.6315789474. This visualization has the following annotations: SOURCE: HUD Point-in-Time data, U.S. totals; National Homeless Counts