Edit chart
Loading graph
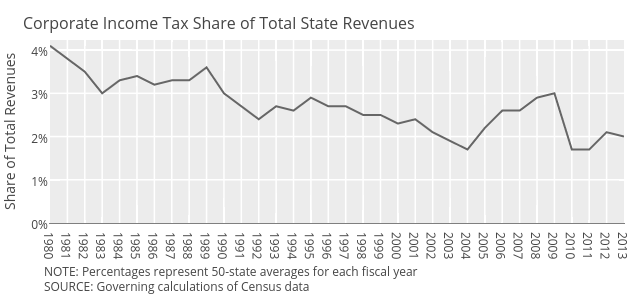
Governing's interactive graph and data of "REvenue Share" is a scatter chart, showing REvenue Share; with Share of Total Revenues in the y-axis. The x-axis shows values from 1980 to 2013. The y-axis shows values from 0 to 4.2333333333333325. This visualization has the following annotations: Corporate Income Tax Share of Total State Revenues; NOTE: Percentages represent 50-state averages for each fiscal year; SOURCE: Governing calculations of Census data