Edit chart
Loading graph
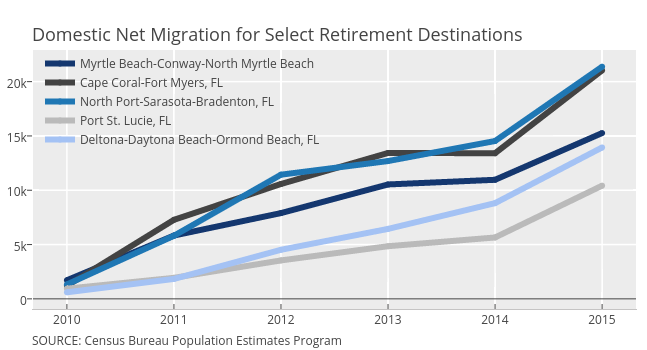
Governing's interactive graph and data of "Myrtle Beach-Conway-North Myrtle Beach, Cape Coral-Fort Myers, FL, North Port-Sarasota-Bradenton, FL, Port St. Lucie, FL, Deltona-Daytona Beach-Ormond Beach, FL" is a scatter chart, showing Myrtle Beach-Conway-North Myrtle Beach, Cape Coral-Fort Myers, FL, North Port-Sarasota-Bradenton, FL, Port St. Lucie, FL, Deltona-Daytona Beach-Ormond Beach, FL. The x-axis shows values from 2009.6832959641256 to 2015.3167040358744. The y-axis shows values from -934.6436170212767 to 22912.643617021276. This visualization has the following annotations: SOURCE: Census Bureau Population Estimates Program; Domestic Net Migration for Select Retirement Destinations