Edit chart
Loading graph
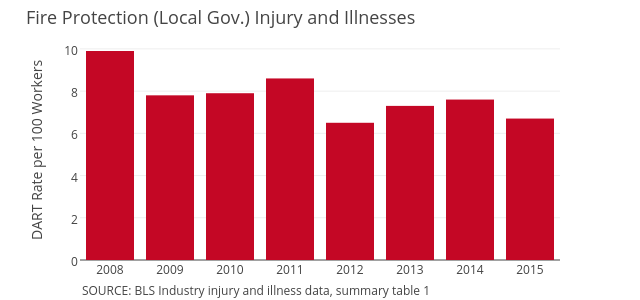
Governing's interactive graph and data of "Col1" is a bar chart, showing Col1; with DART Rate per 100 Workers in the y-axis. The x-axis shows values from 2007.5 to 2015.5. The y-axis shows values from 0 to 10.421052631578949. This visualization has the following annotations: Fire Protection (Local Gov.) Injury and Illnesses; SOURCE: BLS Industry injury and illness data, summary table 1