Edit chart
Loading graph
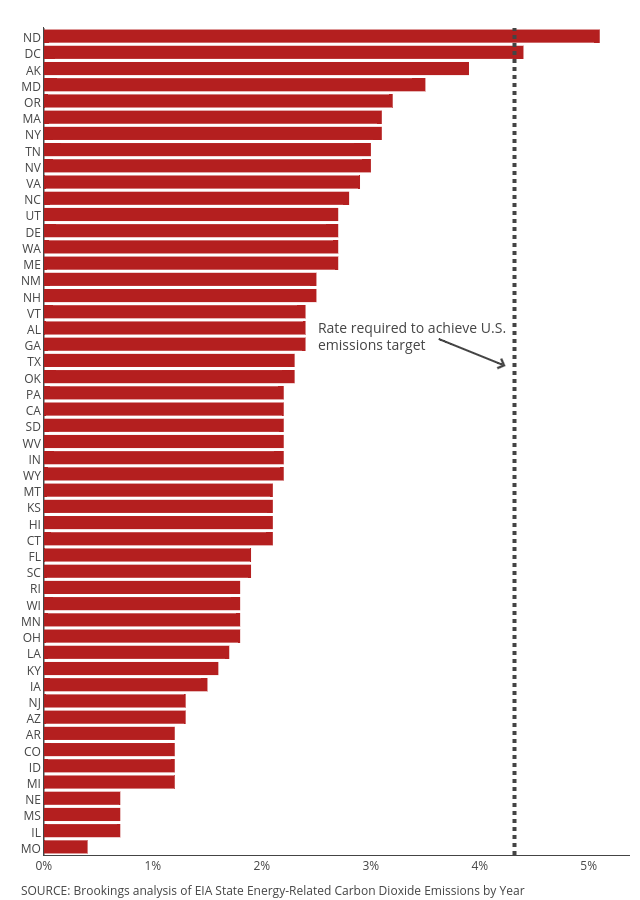
Governing's interactive graph and data of "A" is a bar chart, showing A. The x-axis shows values from 0 to 5.368421052631579. The y-axis shows values from -0.5 to 50.5. This visualization has the following annotations: Rate required to achieve U.S.; SOURCE: Brookings analysis of EIA State Energy-Related Carbon Dioxide Emissions by Year; emissions target