Edit chart
Loading graph
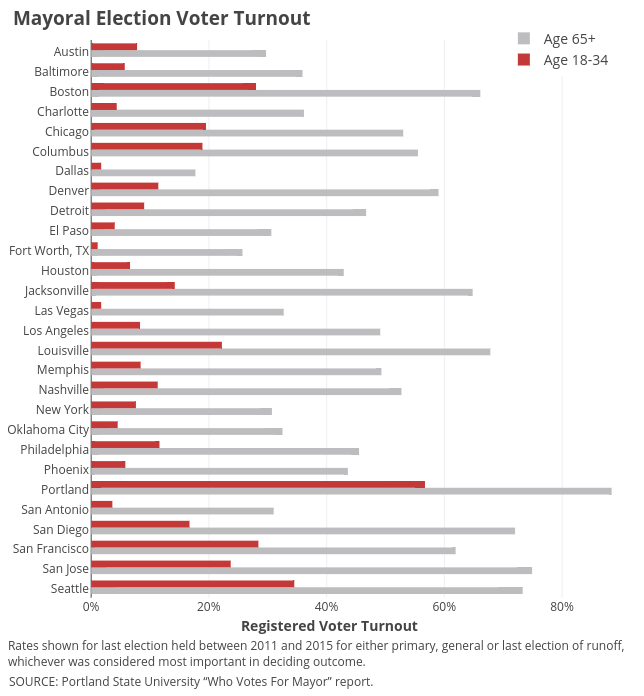
Governing's interactive graph and data of "Age 65+ vs Age 18-34" is a bar chart, showing Age 65+ vs Age 18-34. The x-axis shows values from 0 to 93.05263157894737. The y-axis shows values from -0.5 to 27.5. This visualization has the following annotations: SOURCE: Portland State University “Who Votes For Mayor” report. ; Mayoral Election Voter Turnout; Registered Voter Turnout; Rates shown for last election held between 2011 and 2015 for either primary, general or last election of runoff, whichever was considered most important in deciding outcome.