Edit chart
Loading graph
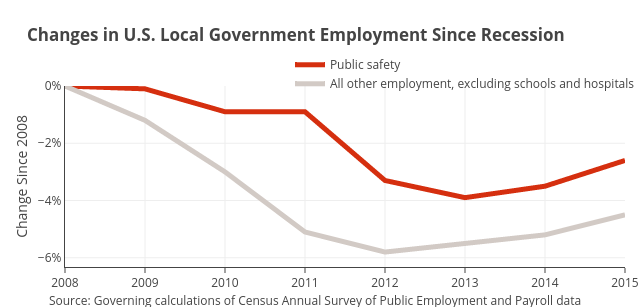
Governing's interactive graph and data of "Public safety vs All other employment, excluding schools and hospitals" is a line chart, showing Public safety vs All other employment, excluding schools and hospitals; with Change Since 2008 in the y-axis. The x-axis shows values from 2008 to 2015. The y-axis shows values from -6.322222222222222 to 0. This visualization has the following annotations: Source: Governing calculations of Census Annual Survey of Public Employment and Payroll data; Changes in U.S. Local Government Employment Since Recession