Edit chart
Loading graph
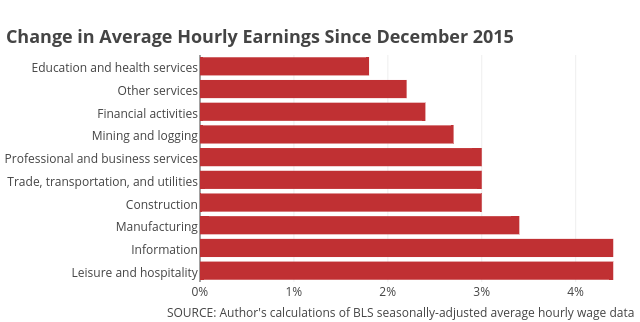
Governing's interactive graph and data of "D" is a bar chart, showing D. The x-axis shows values from 0 to 4.631578947368421. The y-axis shows values from -0.5 to 9.5. This visualization has the following annotations: SOURCE: Author's calculations of BLS seasonally-adjusted average hourly wage data; Change in Average Hourly Earnings Since December 2015