Edit chart
Loading graph
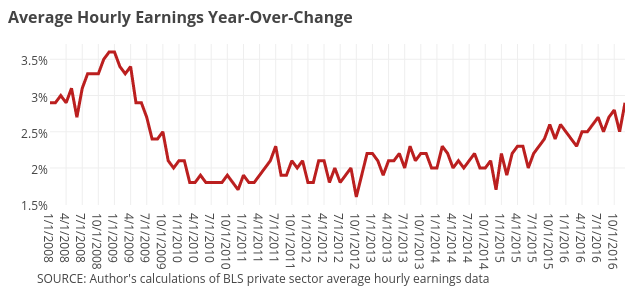
Governing's interactive graph and data of "B" is a line chart, showing B. The x-axis shows values from 0 to 107. The y-axis shows values from 1.488888888888889 to 3.7111111111111112. This visualization has the following annotations: Average Hourly Earnings Year-Over-Change; SOURCE: Author's calculations of BLS private sector average hourly earnings data