Edit chart
Loading graph
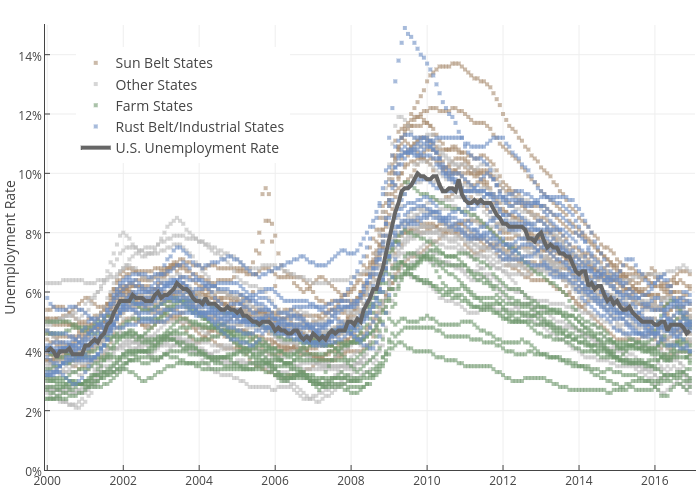
Governing's interactive graph and data of "Unemployment Rate vs time" is a scatter chart, showing Sun Belt States, Other States, Farm States, Rust Belt/Industrial States, U.S. Unemployment Rate; with time in the x-axis and Unemployment Rate in the y-axis.. The x-axis shows values from 1999-12-10 04:42:10.9261 to 2017-1-20 06:41:35.5505. The y-axis shows values from 0 to 15.