Edit chart
Loading graph
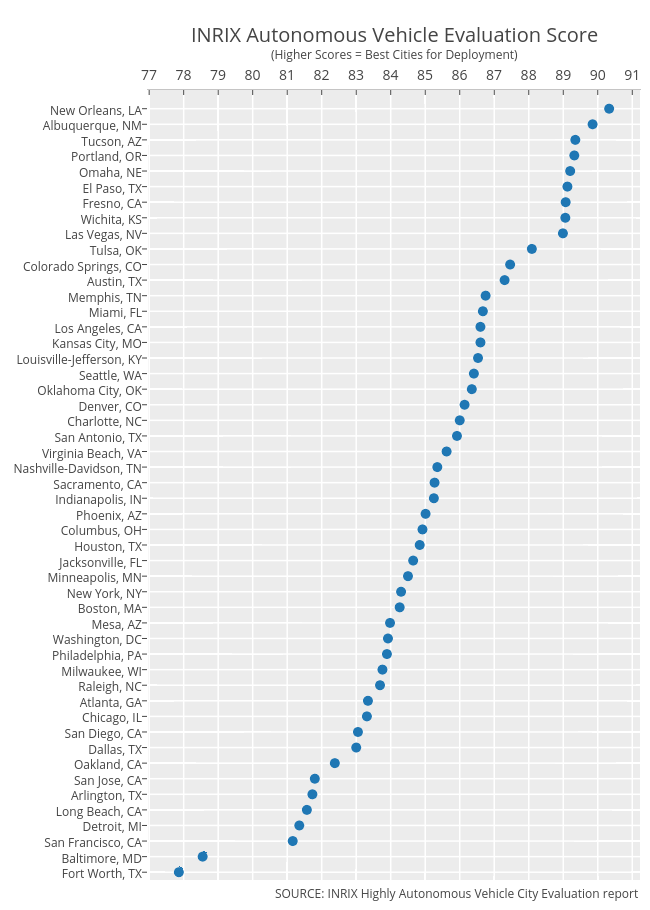
Governing's interactive graph and data of "Col2" is a scatter chart, showing Col2. The x-axis shows values from 76.96597373925168 to 91.22402626074832. The y-axis shows values from -0.5 to 50.2. This visualization has the following annotations: INRIX Autonomous Vehicle Evaluation Score; (Higher Scores = Best Cities for Deployment); SOURCE: INRIX Highly Autonomous Vehicle City Evaluation report