Edit chart
Loading graph
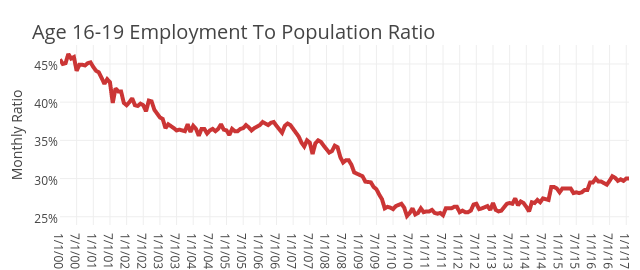
Governing's interactive graph and data of "Age 16-19" is a line chart, showing Age 16-19; with Monthly Ratio in the y-axis. The x-axis shows values from 0 to 205. The y-axis shows values from 23.922222222222224 to 47.477777777777774. This visualization has the following annotation: Age 16-19 Employment To Population Ratio